Showing 421-432 of 555 posts

2022's Historic Low Turnout: Only 64.77% of Registered Voters Showed Up
Kenya's 2022 general election recorded a turnout of just 64.77% — a dramatic 13-point plunge from 78% in 2017. Out of 22...

DIASPORA 2027 Forecast: Turnout, Stronghold Pressure, and the Votes That Will Matter
A practical county forecast for DIASPORA: turnout trend from 2013-2022, the 2022 winning bloc, and how campaign teams ca...

Independent Candidates: 4,002 Ran in 2017, Only 125 Won
In 2017, 4,002 candidates ran as independents across all six elective positions. Only 125 won — a success rate of just 3...

BUSIA 2027 Forecast: Turnout, Stronghold Pressure, and the Votes That Will Matter
A practical county forecast for BUSIA: turnout trend from 2013-2022, the 2022 winning bloc, and how campaign teams can p...

What Agents Must Do During Counting: A Practical Checklist
A practical 15-point checklist for party agents during vote counting at Kenyan polling stations: from verifying your app...
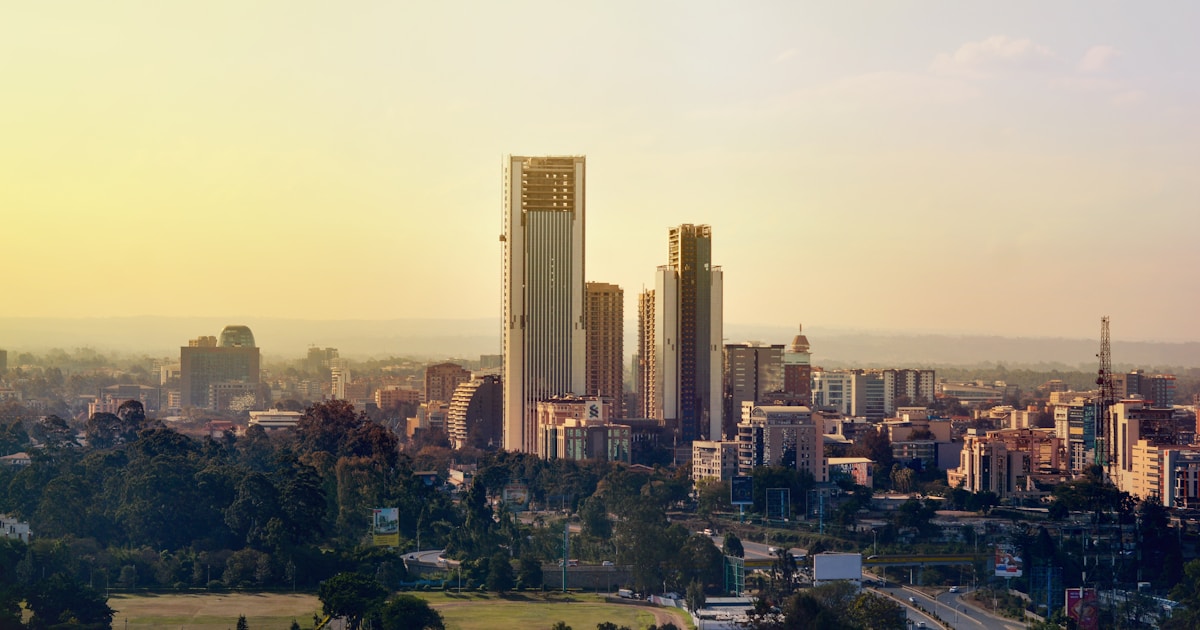
2022 County Spotlight: Nairobi — 2.42 Million Voters, 12,869 Rejected Ballots
Nairobi County had 2,416,551 registered voters in 2022 — the largest electorate in Kenya. Odinga won it with 767,395 vot...

BUNGOMA 2027 Forecast: Turnout, Stronghold Pressure, and the Votes That Will Matter
A practical county forecast for BUNGOMA: turnout trend from 2013-2022, the 2022 winning bloc, and how campaign teams can...

The MCA Landscape: 1,448 Wards, 41 Parties, and the Most Diverse Political Arena
The 2017 MCA elections were the most politically diverse contest in Kenya. While 21 parties won National Assembly seats,...

Kibaki vs Raila: The Numbers Behind Kenya's Most Disputed Election
A province-by-province breakdown of the 2007 presidential election reveals why the results remain Kenya's most disputed....
BOMET 2027 Forecast: Turnout, Stronghold Pressure, and the Votes That Will Matter
A practical county forecast for BOMET: turnout trend from 2013-2022, the 2022 winning bloc, and how campaign teams can p...

Statutory Result Forms in Kenya: What Form 34A to 39A Capture and Why Agents Sign
A detailed guide to statutory result forms 34A through 39A used in Kenyan elections: what each form captures, why agents...

BARINGO 2027 Forecast: Turnout, Stronghold Pressure, and the Votes That Will Matter
A practical county forecast for BARINGO: turnout trend from 2013-2022, the 2022 winning bloc, and how campaign teams can...